When you receive your lab results, you’ll notice two different types of grading systems: the “lab reference range” and our clinical optimization grades “SiPhox Grades”. Understanding the difference between these approaches can help you make better decisions about your health.
Laboratory Reference Ranges: How They’re Determined
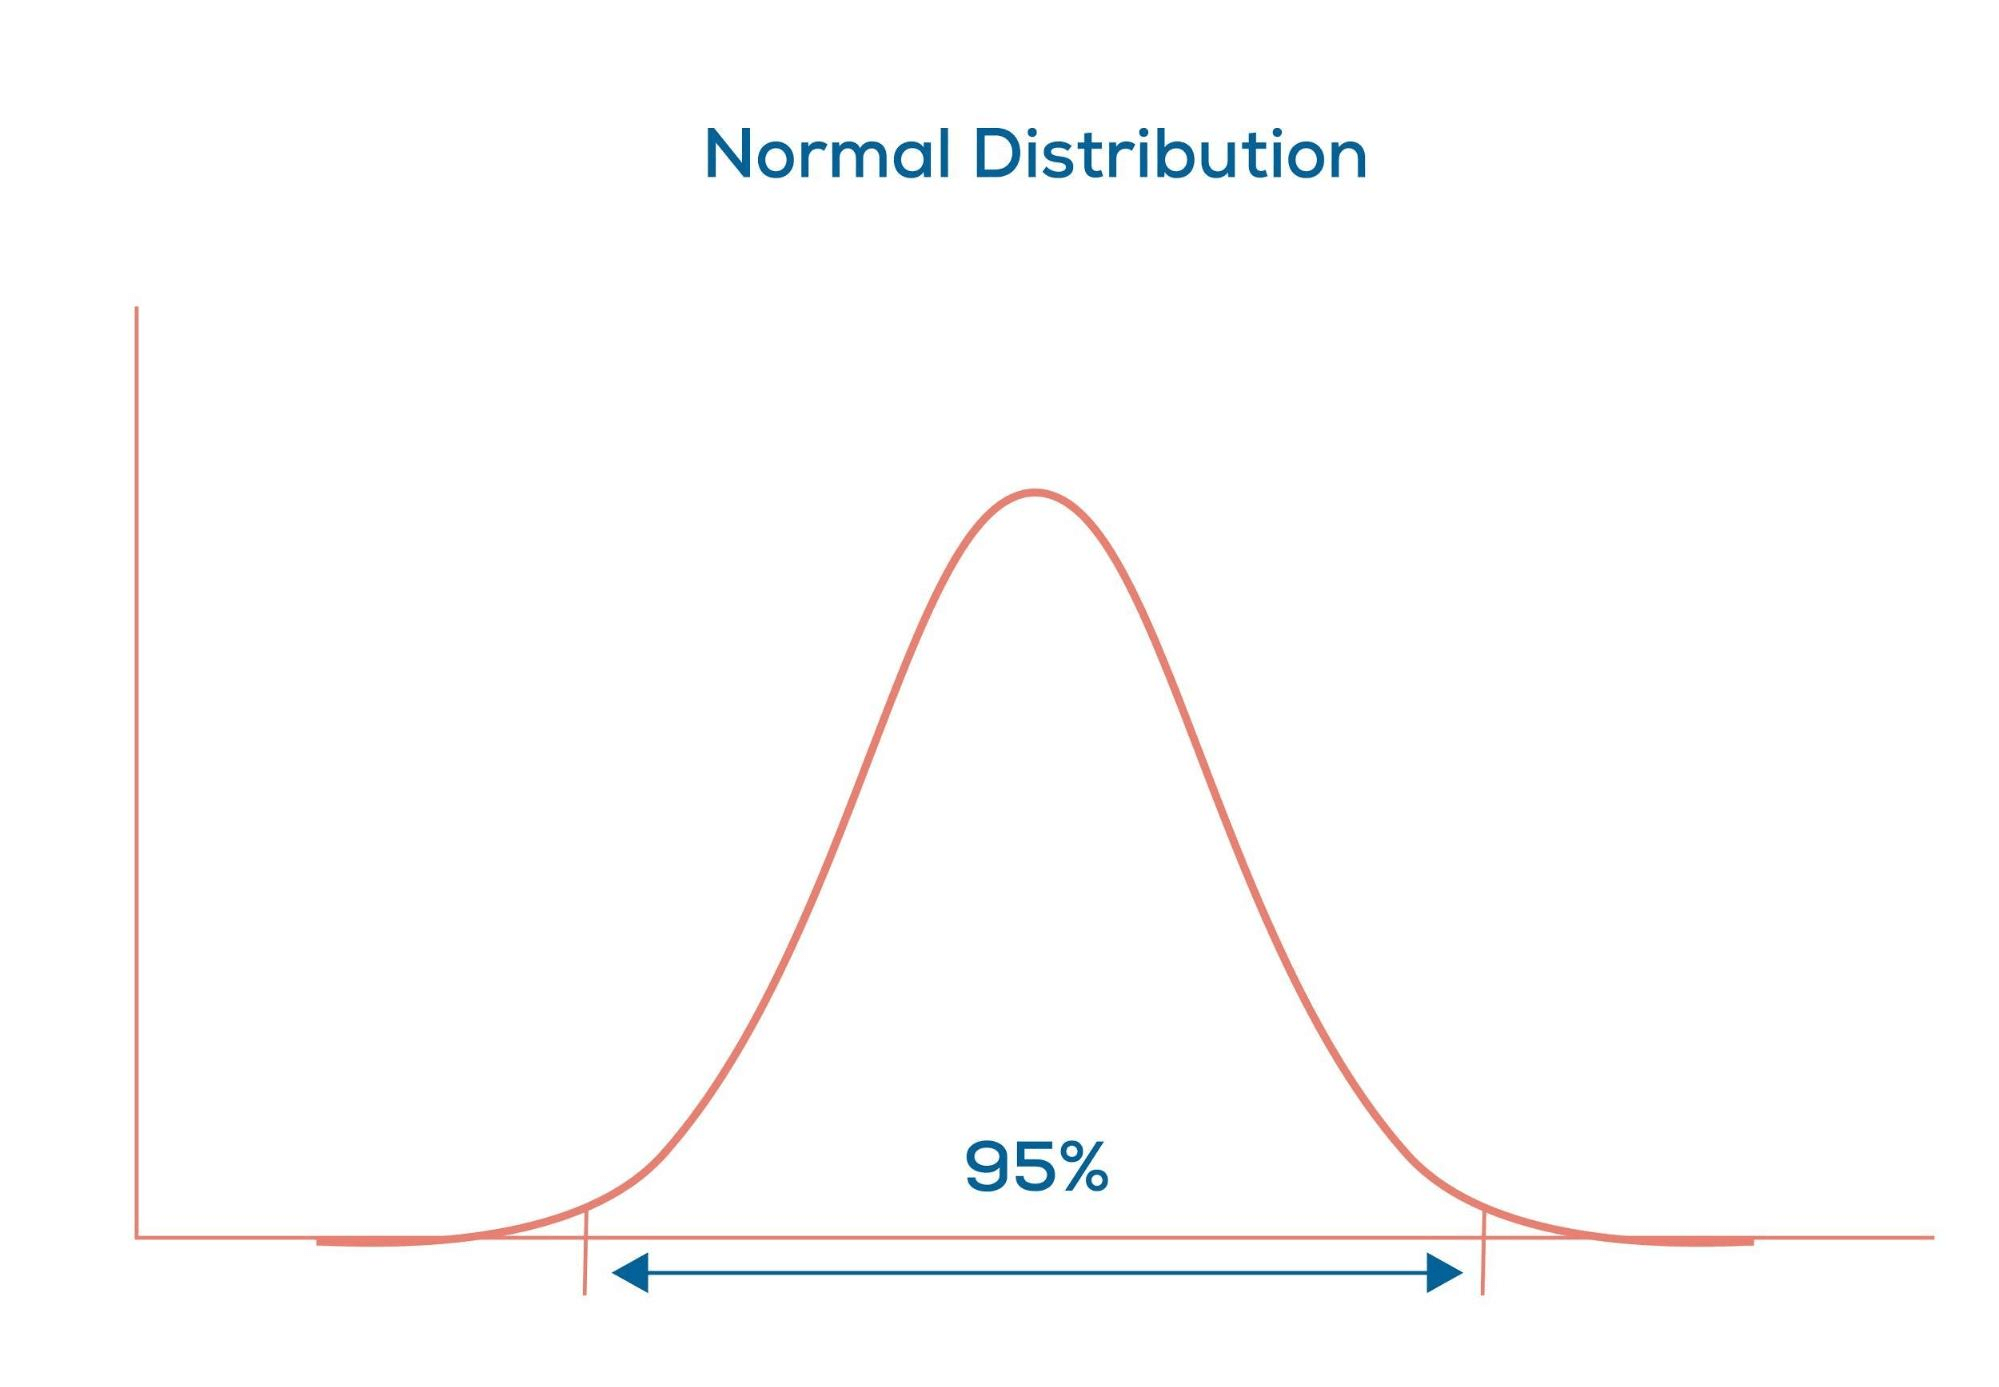
Laboratory reference ranges are typically established through a standardized process:
- Testing a large sample of the local population
- Including people who aren’t necessarily in optimal health
- Using statistical analysis to include approximately 95% of results
- Creating a bell curve of results and setting ranges based on standard deviations
- Focusing primarily on identifying disease states rather than optimal health
This means these ranges are designed to identify clearly abnormal results rather than guide you toward optimal health. They reflect what’s common in the general population, not what’s ideal for your wellbeing.
Our SiPhox Grades: A Research-Based Approach
Our grading system is fundamentally different. We determine our ranges through:
- Comprehensive review of peer-reviewed clinical studies
- Analysis of research linking specific biomarker levels to health outcomes
- Evaluation of data from longevity and wellness research
- Integration of findings from multiple populations and health contexts
- Focus on identifying truly optimal ranges for health and performance
This evidence-based approach allows us to provide more refined and meaningful grades for those looking to improve their health beyond “average”:
Pay Attention (Red)
- Results requiring proactive attention and intervention
- Often still falls within standard laboratory “normal” ranges
- Our more stringent criteria serve as early warning signals
- Allows for preventive action before markers become out of range
- Based on clinical evidence of potential health impacts
- May indicate need for lifestyle changes or medical consultation
- Represents an opportunity for early intervention
Fair (Yellow)
- Results that fall short of evidence-based optimal ranges
- Based on studies showing room for health improvement
- May be “normal” by standard ranges but below optimal
- Indicates opportunity for targeted optimization
Good (Blue)
- Results aligned with positive health outcomes in research
- Better than population averages
- Supported by studies showing good health markers
- Represents solid foundation for wellness
Optimal (Green)
- Results matching levels seen in research on exceptional health
- Based on studies of longevity and peak performance
- Aligned with best documented health outcomes
- Represents evidence-based ideal targets
Why Our Approach Makes a Difference: A Practical Example
Let’s take Vitamin D as an example:
- Standard laboratory range: 25-100 ng/mL
- Our evidence-based optimization grades:
- Pay Attention: < 30 ng/mL or > 100 mg/mL
- Fair: 30-35 ng/mL
- Good: 35-40 ng/mL
- Optimal: 40-70 ng/mL
While a result of 32 ng/mL would be “within range” on a standard report, research shows better health outcomes at higher levels. Our grades reflect this scientific evidence rather than just population averages.
The Power of Evidence-Based Optimization
Our approach offers several advantages:
- More nuanced understanding of your health markers
- Grades based on actual health outcomes rather than population statistics
- Targets derived from scientific research rather than averages
- Focus on optimization rather than just avoiding disease
Remember: Standard ranges tell you if you’re similar to the general population. Our grades tell you how close you are to optimal health based on clinical evidence. This difference empowers you to make more informed decisions about your health journey.