
Weight progress
Steady, healthy loss
-24 lb
From 240.7 lb to 216.5 lb - 3 months on therapy
STARTMONTH 1MONTH 2TODAY
+ Shipping & handling.
SiPhox has made getting my health in check very easy and clear. They offer more biomarkers than other at-home bloodwork health companies.
As someone with severe needle phobia and strong vasovagal responses, this experience was amazing.
Track what appetite suppression and weight loss may be doing to your metabolism, heart health, hormones, nutrition, muscle, and overall health.
Useful before you start, while you are using GLP therapy, and as you taper off.
How well your body is handling GLP, built from your labs, body composition, and symptom check-ins.
Your body's response to GLP therapy, scored from labs, body comp, and symptoms.
Compares progress between tests
Track fat loss versus lean mass
Track what changes between tests
GLP medications can drop the number on the scale fast, but how much of that loss is fat versus muscle? Our GLP optimization program tracks both alongside your biomarkers, ensuring a stronger, healthier you.
From 240.7 lb to 216.5 lb - 3 months on therapy
GLP therapy is known for GI side effects, but fatigue, brain fog, constipation, hair shedding, and muscle loss are often downstream signals of lower appetite, lower calories, and lower nutrient availability.
Nausea, diarrhea, vomiting, and constipation were common during treatment, especially around dose escalation.
Hair loss often lags behind under-fueling, protein gaps, iron depletion, vitamin D changes, or metabolic stress.
Frequent bloodwork and body-composition tracking can surface nutrient depletion, excessive weight-loss pace, dehydration pressure, or metabolic imbalance early enough to adjust diet, supplementation, training, or dosing conversations proactively.
Lower appetite can create sustained calorie deficits and under-fueling before you notice it day to day.
Rapid weight loss plus lower protein, iron, B12, folate, or vitamin D intake can stress hair follicles.
Reduced thirst, nausea, and smaller meals can lower fluid and electrolyte intake.
Fast weight loss with insufficient protein or resistance training can reduce lean mass.
The panel is built for people already using, planning to use, or transitioning off GLP-based medication who want better trend visibility.
HbA1c, estimated average glucose, C-peptide, and lipid trends help show whether your metabolism is changing in the right direction.
Track BUN, creatinine, eGFR, liver markers, bilirubin, & inflammation markers, and physical symptoms to flag changes that deserve attention during rapid weight loss.
Weight alone can hide lean-mass loss. The SiPhox app helps you monitor body composition so you can adjust protein, training, and pace.
B12, ferritin, thyroid, and testosterone markers help explain fatigue, brain fog, recovery, libido, and mood during lower food intake.
Biomarkers, wearables, lab uploads, supplements, insights, actions and more, all in one dashboard.
6 systems improved since your last test, Liver Health the most at 9%. Nutritional is still out of range, so your plan targets it next. Let’s keep it going!
A routine built from your biomarkers. Take action to hit your outlook by your next test.
See a doctor to discuss your elevated AST levels and, in the meantime, maintain a healthy lifestyle to support liver function.
See a doctor to discuss your elevated Triglycerides:HDL ratio and its implications for insulin resistance and cardiovascular risk; in the meantime, monitor your levels and consider lifestyle changes to manage your health.
Sets the day.
Taurine has some of the better amino-acid data for metabolic health, with supportive evidence for improved glycemic control and insulin sensitivity, especially in obesity or diabetes.
Lifestyle measures may help support a healthier SHBG pattern. Focus on limiting heavy alcohol intake and eating enough total calories and protein, since excessive alcohol use and low protein intake have both been associated with higher SHBG. Strength training, quality sleep, and stress management can still support overall metabolic and hormonal health, but direct evidence that they lower high SHBG is limited.
Increasing sun exposure (15-20 minutes daily) or regularly taking an over-the-counter Vitamin D supplement can help boost your Vitamin D levels. The recommended dosage of Vitamin D intake ranges from 600 IU to 4000 IU per day as needed. If you already take vitamin D supplements, consider increasing the dosage.
Where your active plan could move your health by your January panel.
Estimates use the biomarkers targeted by your active actions. Actual results may vary based on consistency, biology, and other health changes.
Everything you need to track, understand, and optimize your health.
Test your biomarkers with comprehensive panels without leaving home.
Chat with Sai, about your results, health and longevity.
Catch nutritional deficiencies early.
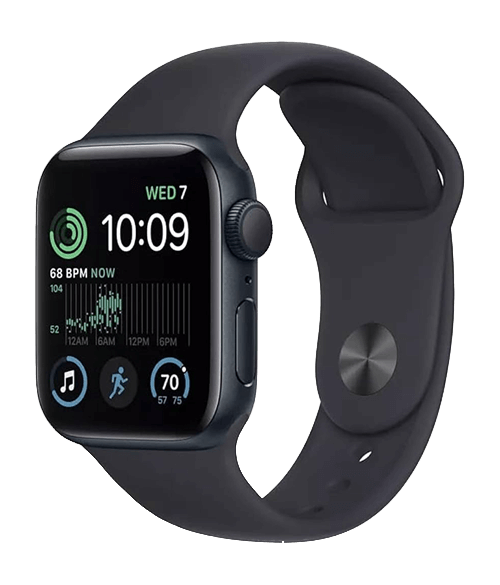
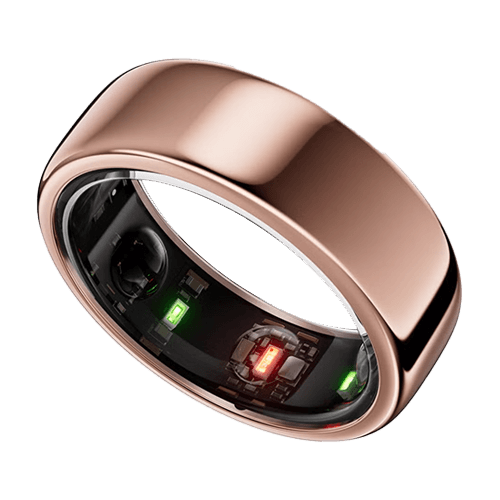
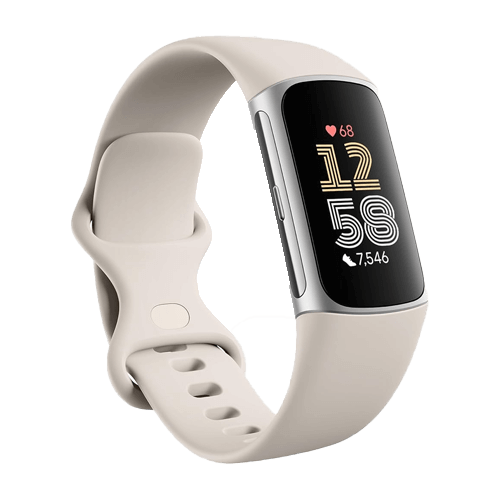
Connect your wearables to track sleep, activity & glucose.
Ensure you are losing weight in a healthy way by connecting fat loss, lean mass, symptoms, and biomarkers in one GLP optimization loop.
Capture your weight, body composition, labs, hydration, and nutrition before you compare trends.
See whether weight loss is coming from fat, not muscle, while symptoms and biomarkers stay on track.
Track fat loss and lean-mass preservation alongside your biomarker trends.
Track fat loss and muscle preservation beside your biomarker trends.
The panel focuses on the markers and explanations that matter most when appetite, weight, hydration, and body composition are changing. Start with key markers, then explore the full panel by category.
Shows your average blood sugar over the past three months. GLP-based therapies often improve this dramatically, so tracking it lets you see one of the clearest wins from treatment.
Shows how much insulin your body is producing. Useful context when appetite, blood sugar control, and metabolic demand are changing.
Counts the particles most tied to atherosclerotic risk, giving a sharper signal than LDL alone.
Tracks low-grade inflammation, a useful signal when metabolic risk and body composition are changing.
A liver enzyme that can improve as fatty-liver stress decreases during weight loss.
Helps show whether you may be dehydrated, especially during dose increases when nausea and reduced fluid intake can creep up.
An essential nutrient that can drop when you eat less meat, fish, dairy, and eggs. Low B12 can cause fatigue and brain fog.
Your iron storage. Especially important for women because low iron can quickly lead to fatigue and lower exercise capacity.
Tracks muscle versus fat instead of only total weight. The goal on therapy is to lose fat while keeping muscle.
Join over 100,000 individuals who have taken control of their health through data-driven insights and actions.

Colin's Story
SiPhox caught what no one saw

Chanda's Story
A dangerous heart risk came to light

Ben's Story
Testing uncovered type 1 diabetes

Jonathan's Story
A shockingly high bioage revealed the truth

Our servers meet or exceed all applicable data protection and privacy requirements. Your sensitive information is safeguarded by state-of-the-art security measures.

We have a strict no-sell policy for your personal information. Your data remains yours, period.

Delete your personal information from our servers at any time. We respect your right to data ownership and provide easy-to-use tools for data management.


